Brighton Energy Coop’s solar systems are outperforming expectations by at least 10% since we installed in mid July.
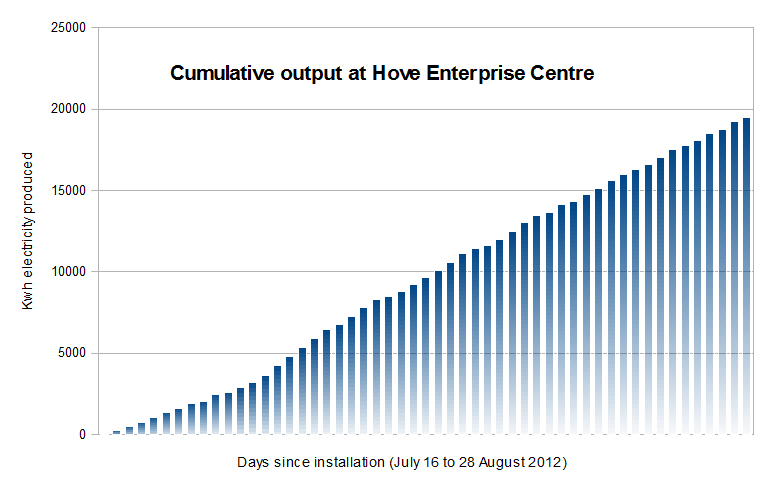
As the graphs here show, our solar system at Hove Enterprise Centre (HEC – 66% of our total system) has now generated nearly 20,000 KwH of solar electricity. To put that in context, that’s the equivalent of boiling the kettle 600,000 times.
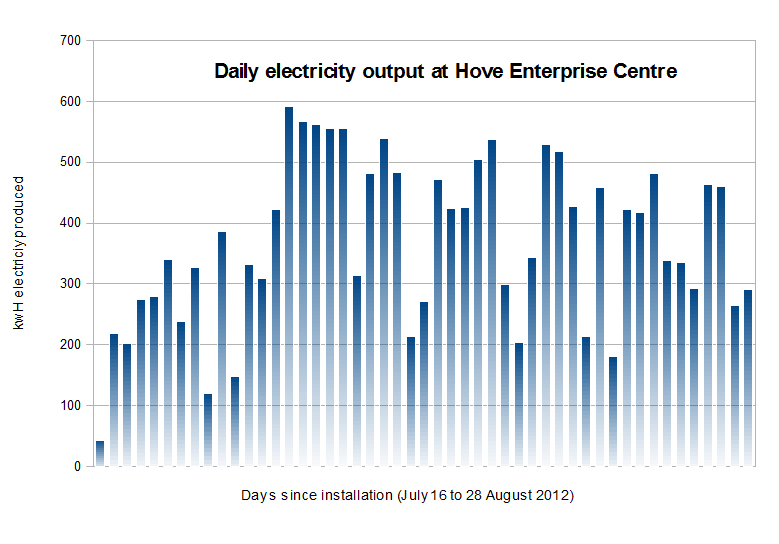
Output, of course, varies from day to day. Below you can see the increases in output created by the sun during the Olympic period in mid July, as well as increased electricity production across the regular sunny spells of August:
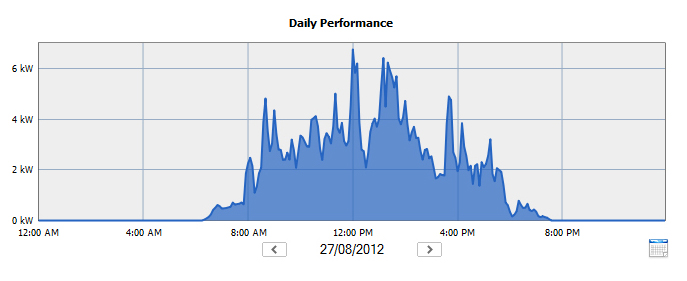
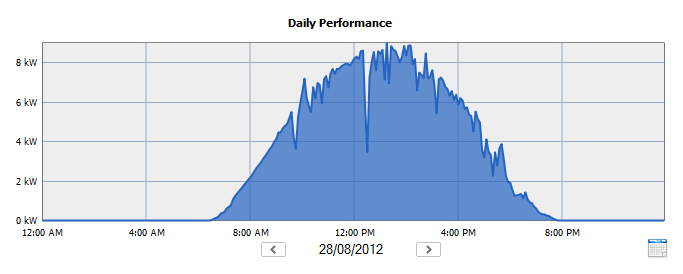
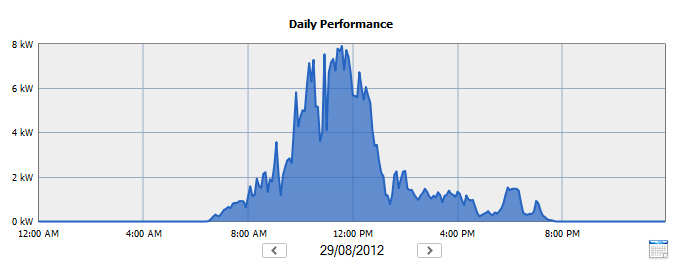
Every day has different sunlight characteristics. Below you can see the output from one array (part of the whole system) at HEC over three consecutive days. Note the almost perfect conditions of last Tuesday (you can clearly see a cloud appearing shortly after 12pm):
27th August:
28th August:
29th August:
A key factor in analysing our solar system is working out how efficient the system is. To calculate this, it’s necessary to look at how much sunlight there is during each month of the year. Based on the 20 year averages from the Met Office station at Eastbourne August receives 12.54% of the annual sunlight. December, on the other hand, receives only 3.14% (gulp!).
Since we know the output of our system from August, to arrive at an expected annual efficiency figure we then divide output by the percentage of annual sunlight multiplied by the system size (87Kwp at HEC).
Interestingly, the result is at least 10% higher than the prediction we used in our financial modelling.
This is because we used government-approved SAP figures for our efficiency predictions. SAP is based on sunlight in Sheffied which obviously receives less than Brighton. At the time of modelling we felt it prudent to use the conservative figure, and we will continue to assume this figure until we have data for at least six months.
In the meantime, however, it looks like we have underestimated our systems’ potential.
It’s important to note that these efficiency calculations are based 20 years’ historical data, not the actual amount of sunlight that August 2012 received. We will know this in the next few days when the Met Office publish it.
In the meantime we’d like to see what you think. Was this August more or less sunny – or just average? Click here to fill your answer in this short survey. We’ll let you know the real amount of sunlight when we have it!
Finally, don’t forget that we have an open evening at Hove Enterprise Centre on 6pm, Wednesday 5th September. Representatives from Shoreham Port and Brighton Energy Coop will show visitors around our solar system and explain how the whole thing works. See here for a map.
Hope to see you there!
Cheers
Will
BEC
